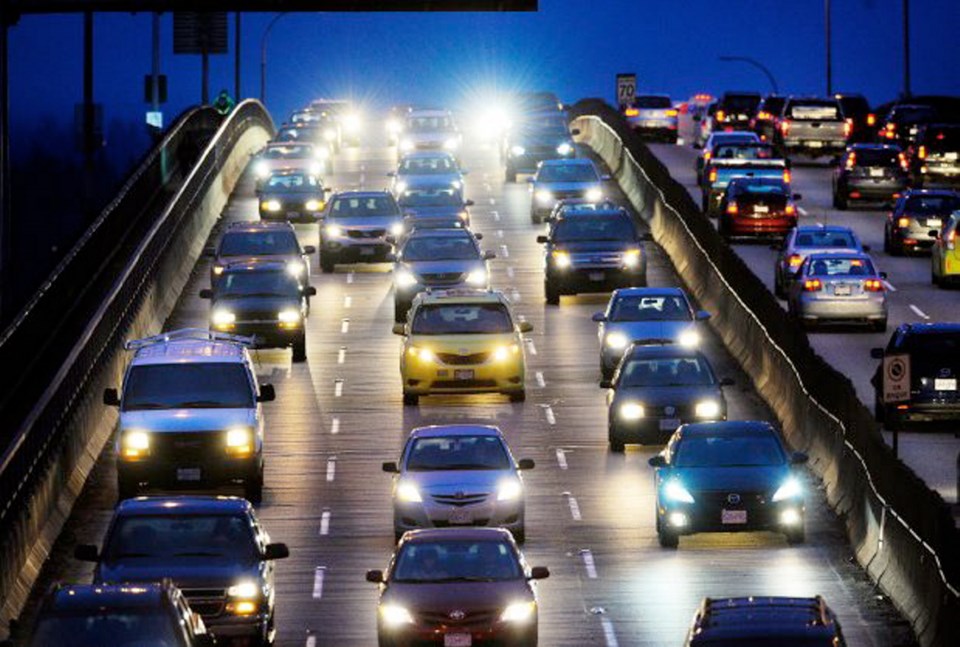
VANCOUVER ŌĆö Those rush-hour shortcuts youŌĆÖre taking are actually adding time to your commute, according to a study released Tuesday morning by a company that makes navigation devices for cars.
ŌĆ£We discovered, or confirmed, that secondary roads have as much or more congestion as highways,ŌĆØ Jocelyn Vigreux, president of TomTom North America, said.
For their studyŌĆÖs sake ŌĆö the data of which is collected from drivers using TomTom navigation devices in their vehicles ŌĆö the company defined a secondary road as any that is not a highway.
In other words, any road that has no designated on-ramps and exits.
Under that definition, slow-motion crawl routes include the likes of Cambie, Broadway, Terminal and Hastings in 91įŁ┤┤, River Road in Surrey and Delta, Taylor Way in West 91įŁ┤┤ and Steveston Highway in Richmond.
ŌĆ£One thing thatŌĆÖs a bit different than the previous index [released by TomTom last year] is we really looked at getting much more information from secondary roads,ŌĆØ Vigreux said.
That 2013 report garnered a lot of criticism for its methodology.
But any way you measure it, there is a problem, said Tamim Raad, director of strategic planning and policy with TransLink.
ŌĆ£I probably wouldnŌĆÖt choose their method of measure, but we donŌĆÖt get [worked up] about the methodology,ŌĆØ Raad said. ŌĆ£There is a real problem we have in this region.
ŌĆ£Congestion has a real impact on the economy and the day-to-day lives of people.
ŌĆ£At the end of the day [congestion] really impacts everybody.ŌĆØ
Since TransLink was created 15 years ago, more than half a million people have moved to the Lower Mainland, Raad said.
And since then, 80 per cent more people use public transit than did in 1999, he added.
As for passenger cars, the number registered from 2009 to 2013 in the Lower Mainland grew by 57,000 to 1.285 million, according to ICBC.
That number could jump to two million vehicles in the Lower Mainland in the next 25 to 30 years, according to a recent study by the Business Council of B.C. that predicts the Lower MainlandŌĆÖs population will grow by a million in that span.
Ridership on public transit, meanwhile, declined by almost five million passengers in 2013, down two per cent from 2012 to just under 234 million paying passengers.
91įŁ┤┤ is regularly ranked the most livable city in the world, or at least makes it into the top three or four.
So itŌĆÖs ironic it has the worst traffic congestion in North America, according to TomTom, worse even than Los Angeles for the second year in a row (and third worst in the Americas).
ŌĆ£A few things jumped out at me, and the first was congestion is increasing,ŌĆØ TomTomŌĆÖs Vigreux said. ŌĆ£ThatŌĆÖs something we see globally and that we see in North America, and we see it specifically in 91įŁ┤┤.ŌĆØ
Average commutes in Toronto and Montreal actually take a bit longer than the average Metro 91įŁ┤┤ commute. But TomTom measures congestion as the difference in the length of a commute between peak and low periods.
The wasted time Metro 91įŁ┤┤ commuters spend stuck in traffic yearly is 87 hours, according to TomTom.
ŌĆ£Traffic congestion is nothing new and continues to be a global challenge,ŌĆØ Harold Goddijn, CEO of the Dutch nagivation-equipment maker, said. ŌĆ£The traditional responses to congestion, such as building new roads or widening existing ones, are no longer proving to be effective.ŌĆØ
ŌĆ£If you look at only an extra half hour a day, it creeps up,ŌĆØ Vigreux added. ŌĆ£Traffic is a pain, we know that. You look at 91įŁ┤┤, the city is growing, attracting new people. ItŌĆÖs a city that is morphing and it looks attractive.
ŌĆ£There are bike lanes, more pedestrian areas, better mass transit, and it all takes away a bit of space that used to be given to cars.
ŌĆ£There are two sides to the coin: There is unavoidable traffic and congestion issues; on the other hand, you have a vibrant, growing city trying to make itself better for its people.ŌĆØ
MOST CONGESTED RUSH HOURS IN CANADA
╠²
1. 91įŁ┤┤
2. Toronto
3. Ottawa
4. Montreal
5. Calgary
6. Quebec
7. Edmonton
MOST CONGESTED RUSH HOURS IN THE AMERICAS
╠²
1. Rio de Janeiro
2. Sao Paulo
3. 91įŁ┤┤
4. Los Angeles
5. San Francisco
6. Honolulu
7. Seattle
8. San Jose
9. Toronto
10. Washington
MORE AND MORE CARS ON THE WAY
╠²
Yearly increase in number of vehicles insured in Metro 91įŁ┤┤ since 2008:
2008: 1.489 million
2009: 1.512
2010: 1.526
2011: 1.546
2012: 1.563
2013: 1.581
On average, 50 newly insured vehicles hit the streets of Metro 91įŁ┤┤ each day.


